Infrastructure
Trend Lines Need a Baseline: Read Remote Pressure and Flow Data Before Your Town Acts on It
A remote monitoring dashboard shows a shape, not a cause, so a small system needs a written baseline, a calibration record, and a named response before a rising line turns into a decision.
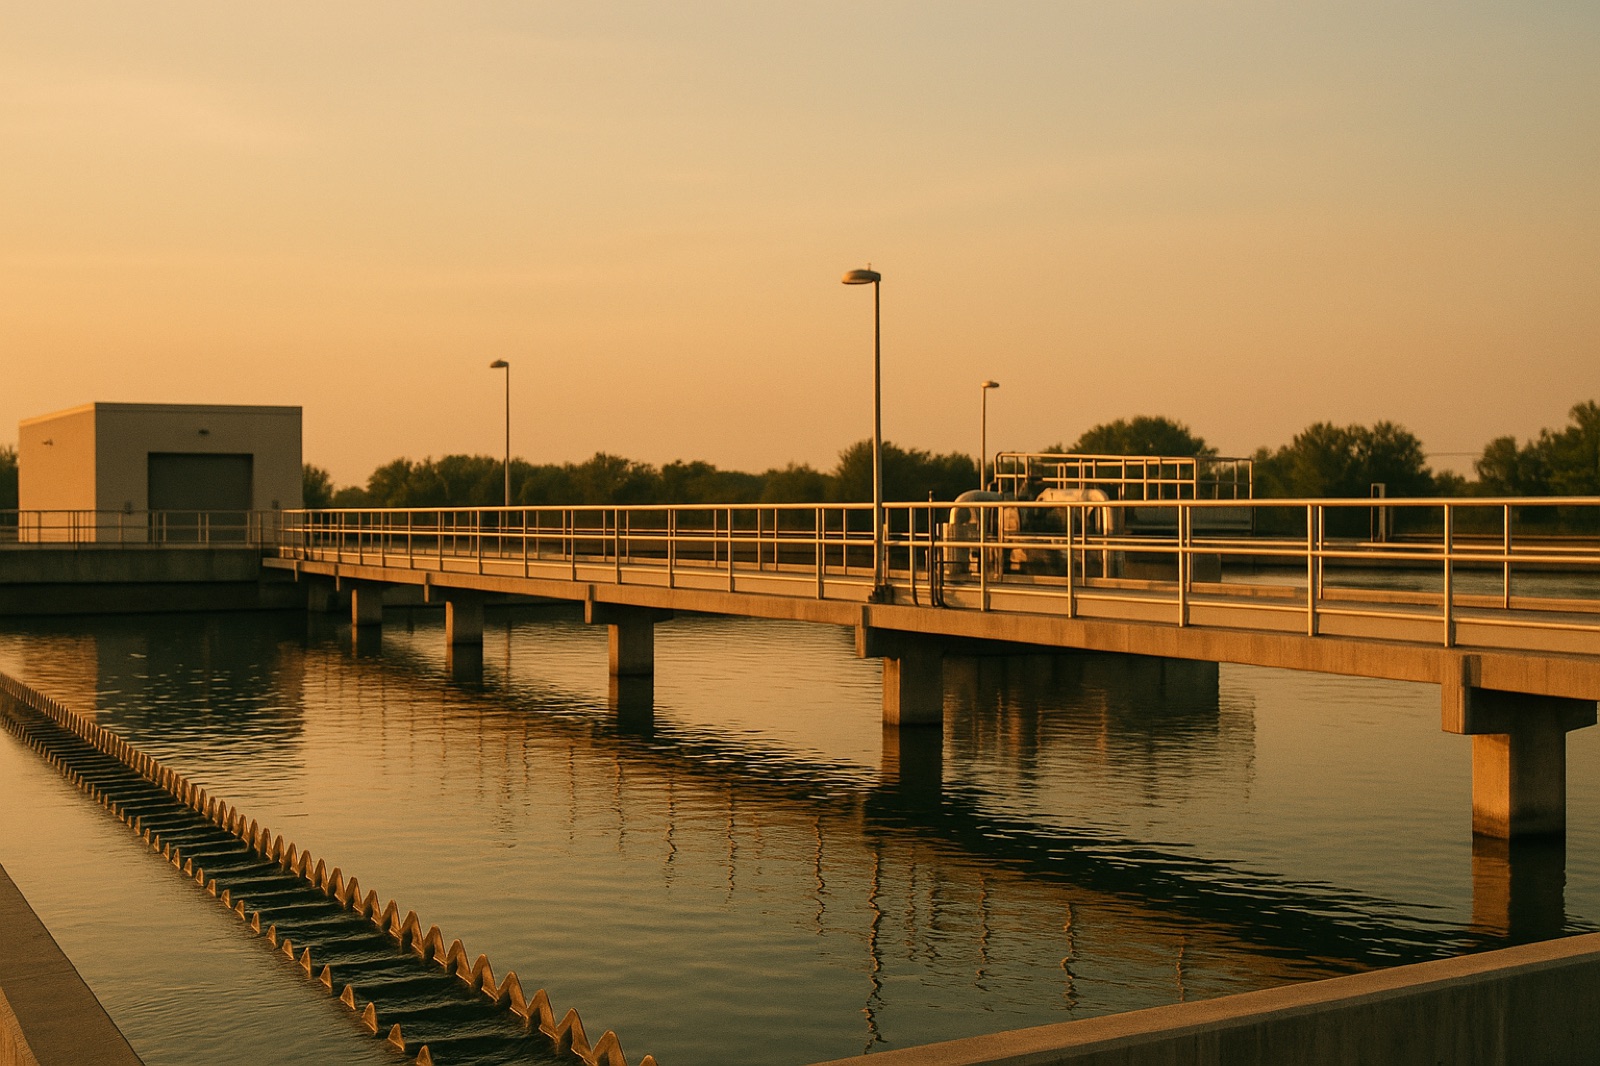
A remote monitoring dashboard can make a small water system look like it has a clear view of its own pipes. A pressure line rises, a flow line dips, and an operator or clerk sees a shape on a screen. What the screen cannot do by itself is explain why the shape changed. Reading that shape well takes a baseline, a record of what normal looked like before the change, and a habit of asking what the sensor was actually measuring.
The question is timely for a practical reason. On Nov. 3, 2026, Water Finance and Management reported that Badger Meter had acquired 37South, a Melbourne, Australia-based company that the report describes as a "utility technology and remote monitoring company." The same report says the deal is the latest in a recent string of acquisitions by Badger Meter, the most recent of which was its purchase of UDlive Limited. The report does not say how any Midwest utility would use the technology, and this article does not assume it. The lesson for a small town is simpler: when monitoring tools change hands, the data they produce can change with them, in format, in recording frequency, and in who keeps the history.
Start With a Baseline
A trend needs something to compare against. Before a town treats a rising reading as a problem, it should know what the same reading looked like across a normal week, a dry spell, a wet spring, and a cold snap. Some small systems keep that picture only in the operator's memory. Memory fades when the operator retires or the clerk inherits an old binder, and the screen then becomes the only record left.
Ask for a short baseline sheet. It should list typical daily ranges for each sensor, the season when each range was recorded, and any equipment changes that could shift a reading, such as a pump replacement, a new meter, or a relocated sensor. Keep that sheet with the operating records, not only inside a vendor portal.
Know What the Sensor Touches
A pressure transmitter at a pump station reports pressure at one point. It does not tell you what a household tap sees, and it does not tell you whether a pipe is leaking somewhere else in the system. A flow meter reports the volume passing a point. A sudden change can mean a leak, a hydrant opened for flushing, a pump cycling differently, or a sensor that has drifted. Each explanation calls for a different response, so the first task is to name which explanations the data can support and which it cannot.
Ask About Calibration and Gaps
Three questions do most of the work. When was each sensor last checked against a known reference, and who performed the check? When readings are missing, are the gaps flagged or silently filled with estimates? And does the platform keep raw readings, or only summaries? Summaries are easier to read and harder to audit. If a question about a leak or a billing error ever arises, the raw record is what lets a town test the explanation against the evidence.
Connect the Trend to a Crew
A trend line is a reason to look, not a finding. Write down the action each alert type triggers. Name who drives out, who calls a contractor, and who notifies the council when a service interruption or a water quality question might be involved. The gap between a screen and a response is where small systems most often stall.
The same gap appears in funding debates. In a Circle of Blue story by Abigail Mihaly, communities across the country are described as facing a "federal water infrastructure funding cliff" after a multibillion-dollar federal cash infusion expired. Money and monitoring share a weakness. Both help only when a town has staff, a written plan, and a record that someone can act on. Tools that show a system's condition do not replace the people who must go and look.
A Short Checklist for Your Next Council Meeting
Bring three items. The first is the baseline sheet, with typical ranges, seasons, and equipment changes. The second is a list of alert types paired with the response each one triggers and the person responsible. The third is a question about where raw data is stored and who holds the login. If the monitoring vendor changes, ask the same three questions again, because the answers may change with the contract.
A reading tells you something happened at one point in the system. A baseline, a calibration record, and a named response tell you what to do about it.